
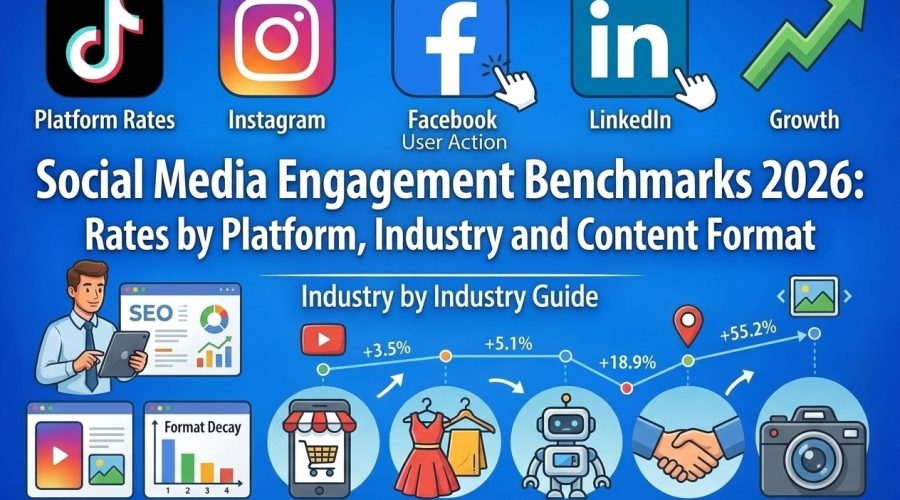
TikTok leads all major platforms with a 3.70% average engagement rate for brand accounts in 2026 — up 49% year-over-year and more than 7 times Instagram's 0.48%. Facebook holds flat at 0.15%, and X (Twitter) declined from 0.15% to 0.12%. LinkedIn PDF carousels are the highest-performing content format across any platform, averaging 21.77% engagement — but that figure applies to that specific format only, not LinkedIn overall. These benchmarks are drawn from Socialinsider's analysis of 70 million brand posts across four major platforms.
Source: DollarPocket.com analysis of Socialinsider, Rival IQ/Quid and Buffer data (2026). Full platform and industry breakdown below.
Sources: Socialinsider 2026 (70M posts); Buffer State of Social 2026 (52M+ posts); Rival IQ / Quid 2026 Benchmark Report (18 industries). Creator vs brand account distinction applies — see methodology note in each section.
Why Most Social Media Benchmarks Are Misleading — and How to Read Them Correctly Before using any engagement benchmark, you need to understand the three variables that explain most of the variance between published figures: account type, sample population, and engagement rate definition. Account type is the biggest source of confusion. Creator and influencer accounts consistently achieve engagement rates 2–5× higher than brand accounts at equivalent follower counts, because personal content generates more genuine interaction than corporate content. When Socialinsider reports a TikTok engagement rate of 3.73%, that figure covers creator accounts across their dataset. When Rival IQ reports 2.01%, that covers brand accounts only — 150 companies per industry, sampled from their database. Both figures are accurate for their respective populations. Comparing them directly is the most common mistake in social media benchmarking. Sample population determines whose data is in the study. Rival IQ samples 150 companies per industry, predominantly US-based national and international brands. Buffer analyzes 52 million posts from their scheduling platform users — a global, mixed population of brands and creators. Socialinsider covers 70 million posts with a strong European brand weighting. These are not the same populations and produce different baselines. Engagement rate definition also varies. Most studies define engagement as (likes + comments + shares) ÷ followers. But some platforms and tools include saves, clicks, profile visits, or story views — each of which inflates the reported rate. The figures in this article use the standard likes + comments + shares ÷ followers definition unless otherwise stated.| Platform | Avg Engagement (Brands) | Avg Engagement (Creators) | YoY Change | Primary Source |
|---|---|---|---|---|
| TikTok | 2.01% | 3.73% | +49% (creator accounts YoY) | Rival IQ / Socialinsider 2026 |
| 2.05% – 3.85% | Up to 21.77% (PDF carousels) | Stable / slight increase | Buffer 2026 / Growth-onomics 2026 | |
| 0.30% – 0.48% | 0.98% – 1.62% | –17% YoY (brands, 0.36% → 0.30%) | Rival IQ 2026 / Socialinsider 2026 | |
| YouTube | Above Facebook & X | Measured by views (not likes/comments) | New to 2026 benchmarks | Rival IQ / Quid 2026 (first year) |
| 0.02% – 0.23% | 0.40% – 1.0% | Flat / gradual long-term decline | Rival IQ 2026 / Socialinsider 2026 | |
| X (Twitter) | 0.03% (Rival IQ brands) / 0.12% (Socialinsider broader) | 0.05% – 0.15% | Rival IQ: +100% (from 0.015% in 2024) / Socialinsider: –20% (from 0.15% to 0.12%) | Rival IQ / Quid 2026 + Socialinsider 2026 (conflicting — see note below) |
| Threads | Replies boost engagement by 42% in first hour | Early-stage benchmarks only | Growing platform — limited 2026 data | Buffer State of Social 2026 |
Sources: Socialinsider 2026 Social Media Benchmarks Report (70M posts, TikTok/Instagram/Facebook/X); Rival IQ / Quid 2026 Social Media Industry Benchmark Report (18 industries, 150 companies each, expanded to include YouTube); Buffer State of Social 2026 (52M+ posts, 10 platforms); Growth-onomics 2026. Note: LinkedIn 21.77% figure is format-specific (PDF carousels only per Buffer 2026 analysis) — not the platform average. Platform average is 2.05%–3.85%. X (Twitter) data conflict explained: Rival IQ (brand accounts only, 18 industries) reports X at 0.03% — doubled from 0.015% in 2024, marking a rebound. Socialinsider (70M posts, broader mixed population including creator and brand accounts) reports X at 0.12% — down from 0.15% in 2024. The difference reflects methodology: Rival IQ measures brand-only accounts in specific industries, while Socialinsider covers a broader population. Brand accounts should use 0.03% as their benchmark; mixed account types should use 0.12%.
| Industry | Instagram Engagement | TikTok Engagement | Facebook Engagement | X Engagement |
|---|---|---|---|---|
| Higher Education | 2.10% | 7.36% | Above median | Above median |
| Sports Teams | Above median | Above median | Above median (leading) | Strong performer |
| Nonprofits | 0.56% | 3.04% | Near median | Near median |
| Food & Beverage | Small gain YoY | Above median | Small gain YoY | Below median |
| Energy | Above median (new 2026) | Strong debut (new 2026) | Above median (new 2026) | Above median (new 2026) |
| Pharma | Above median (new 2026) | Above median (new 2026) | Above median (new 2026) | Above median (new 2026) |
| Financial Services | 0.26% | Near median | Steady | 2× higher YoY (strong outlier) |
| Hotels & Resorts | Near median | Near median | Near median | Near median |
| Media | Near median | Near median | Leading in volume (most posts/week) | Above median |
| Pets | Above median (new 2026) | Above median (new 2026) | Near median | Near median |
| Alcohol | Near median | Below median | Below median (low post frequency) | Below median |
| Fashion | Below median (–30% YoY) | Near median | Sharp slowdown in posting | Near zero (posts ~1/year) |
| Retail | Bottom of pack (–30% YoY) | Below median | Bottom of pack | Below median |
| Technology | Bottom of pack | Below median | Bottom of pack | Near median |
| Beauty | Lowest across platforms | Lowest across platforms | Below median | Near zero |
| All-industry median (brands) | 0.30% | 2.01% | 0.15% | 0.03% |
Source: Rival IQ / Quid 2026 Social Media Industry Benchmark Report (March 2026) — 18 industries, 150 companies sampled per industry, brand accounts only. Higher Education Instagram (2.10%) and TikTok (7.36%) from Rival IQ industry breakdown, confirmed by Apaya 2026. Financial Services Instagram (0.26%) from Rival IQ. "Above/below median" notation used where exact percentage was not published; directional data confirmed by Rival IQ 2026 narrative. Retail and Home Decor Instagram: –30% YoY decline confirmed by Rival IQ 2026 report.
| Format | Platform | Engagement vs Static Image | Key Metric | Source |
|---|---|---|---|---|
| PDF Carousel | 3× higher than video or images | 21.77% median engagement | Buffer 2026 (52M+ posts) | |
| Carousel (swipe) | +109% vs Reels on engagement; +12% more shares | 1.87% avg; highest saves of any format | Buffer 2026 / Socialinsider 2026 | |
| Reels (short video) | +36% more reach than carousels | 2.35% avg engagement; best for discovery | Socialinsider / Growth-onomics 2026 | |
| Short-form video (7–15 sec) | TikTok | Highest performing format on TikTok | 7–15 seconds optimal for maximum engagement | Growth-onomics / Buffer 2026 |
| TikTok photo carousel | TikTok | 2.0%–3.5% engagement | Lower than video but higher save rates — new format launched late 2025 | PostEverywhere 2026 |
| Static image / photo | Baseline (lowest format on Instagram) | 0.94% avg engagement — use sparingly | ScheduleWave / Socialinsider 2026 | |
| Photo tweet / image post | X (Twitter) | 1.5–2× higher than link tweets | Best performing format on X | Rival IQ 2026 |
| Link post | X / Facebook / LinkedIn | Lowest performing format | All platforms algorithmically suppress outbound links | Buffer / Rival IQ 2026 |
| Cross-platform format winner: Short-form video (Reels, TikTok, Shorts) — 2.35% avg cross-platform, highest reach of all formats (Hootsuite 2026) | ||||
Sources: Buffer State of Social 2026 (52M+ posts, 10 platforms); Socialinsider 2026 Benchmark Report (70M posts); Growth-onomics 2026 (aggregated Buffer / Creaticalc data); Rival IQ / Quid 2026; ScheduleWave 2026; PostEverywhere 2026. LinkedIn PDF carousel figure (21.77%) is format-specific, not the platform average — confirmed by Buffer 2026 analysis.
Posting Frequency Benchmarks by Platform 2026 Posting frequency is the most debated variable in social media strategy. The 2026 data from Rival IQ and Buffer points to a clear conclusion: posting frequency across Instagram and Facebook reached its lowest levels in six years in 2026, while engagement held relatively stable — suggesting that posting less but with higher content quality is now the dominant strategy among benchmark-level brands. The data also confirms a no-post penalty: accounts that stop posting entirely see significant and consistent engagement drops across all platforms.| Platform | Median Posts Per Week (Brands) | YoY Change | High-Volume Industries | Source |
|---|---|---|---|---|
| 3.7 posts/week | Lowest in 6 years | Media, Sports | Rival IQ / Quid 2026 | |
| TikTok | 2.0 videos/week | Stable | Higher Education, Sports | Rival IQ / Quid 2026 |
| 3.0 posts/week | Lowest in 6 years | Media (far exceeds median) | Rival IQ / Quid 2026 | |
| X (Twitter) | Slight uptick from 2025 low | First increase in several years | Sports, Media | Rival IQ / Quid 2026 |
| 2–3 posts/week (B2B brands) | Stable | B2B, Technology | Buffer 2026 | |
| Optimal for most brands (all platforms) | 5–7 posts/week per platform | Diminishing returns above 10/week | Significant drop below 3/week | Sprout Social 2026 |
Sources: Rival IQ / Quid 2026 Social Media Industry Benchmark Report (March 2026); Buffer State of Social 2026; Sprout Social 2026 Frequency Study. Note: Rival IQ / Quid 2026 reported Instagram at 3.7 posts/week and Facebook at 3.0 posts/week — both lowest levels recorded in their 6-year benchmark history.
| Follower Tier | TikTok Avg Engagement | Instagram Avg Engagement | Why |
|---|---|---|---|
| Nano (<10K followers) | 4.7% | 2.8% | Intimate audience — high percentage of genuinely interested followers |
| Micro (10K–100K) | 3.0% – 4.0% | 1.0% – 2.0% | Still niche — audience grew from genuine interest |
| Mid-tier (100K–500K) | 2.0% – 3.0% | 0.5% – 1.0% | Passive followers accumulate — not all are actively engaged |
| Macro (500K–1M) | 1.5% – 2.5% | 0.3% – 0.6% | Large inactive follower base dilutes rate |
| Mega / Celebrity (1M+) | 1.0% – 2.0% | 0.1% – 0.3% | Mass appeal reduces niche resonance — broad but shallow engagement |
Source: ScheduleWave 2026 (TikTok 4.7% and Instagram 2.8% for under-10K accounts); GhostShorts 2026 Engagement Rate Calculator (citing Rival IQ and Hootsuite 2026). Mid-tier and macro figures are directional benchmarks derived from platform-level median data — individual account performance varies significantly by industry and content quality.
Platform-by-Platform Analysis: What the 2026 Data Shows TikTok 2026: The Engagement Benchmark Leader TikTok leads all platforms by engagement rate in 2026 — and has done so for three consecutive years. The algorithm-first distribution model means content reaches users who do not follow the account, which naturally inflates per-follower engagement metrics compared to follower-feed platforms like Instagram and Facebook. Two figures circulate for TikTok's 2026 engagement rate: 3.73% from Socialinsider's analysis of creator accounts (70M posts, +49% year-over-year) and 2.01% from Rival IQ's brand-account benchmark (18 industries). Both are accurate for their respective populations. Key 2026 TikTok findings from Socialinsider's report include a 45% year-over-year increase in shares per post — the strongest sharing growth of any platform — alongside a 24% decline in average comments per post, suggesting users are increasingly sharing content passively rather than engaging conversationally. Short-form videos of 7–15 seconds continue to generate the highest engagement. The new TikTok photo carousel format, launched in late 2025, is gaining traction with 2.0%–3.5% engagement rates and higher save rates than equivalent video content. Instagram 2026: Continued Decline, but Reels and Carousels Hold Firm Instagram brand engagement fell 17% year-over-year from 0.36% to 0.30% according to Rival IQ's 2026 benchmark. Retail and Home Decor saw the sharpest individual industry declines at approximately 30% year-over-year. The platform effectively operates as two separate content environments in 2026: Reels generate 36% more reach than carousels but lower engagement per viewer, while carousels generate 12% more engagement and significantly more saves. The optimal content mix according to the aggregated 2026 data is 60–70% Reels for discovery and 20–30% carousels for audience retention and saves. Posting frequency on Instagram fell to 3.7 posts per week — the lowest recorded in Rival IQ's six-year benchmark history. This is not a crisis signal — it reflects a deliberate quality-over-quantity shift. The algorithm in 2026 heavily weights Reels watch time and share-to-impression ratio, meaning engagement quality matters more than volume. LinkedIn 2026: The B2B Engagement Outlier LinkedIn is the most misunderstood platform in engagement benchmarking because of a widely-circulated figure: 21.77% engagement for PDF carousels. This figure, confirmed by Buffer's 52 million post analysis, is format-specific — it applies to document/PDF carousel posts, not to the platform average. The platform-wide average engagement rate on LinkedIn is 2.05%–3.85% depending on the study methodology, with B2B content at the higher end. Replying to comments within the first hour boosts LinkedIn engagement by 30% — the highest comment-reply uplift of any platform, according to Growth-onomics 2026. LinkedIn is also the only major platform where carousels outperform video by a factor of 3×. This makes it a structural exception to the "video-first" guidance that applies to every other platform in 2026. Facebook 2026: Organic Reach at Historic Lows Facebook organic engagement for brand accounts ranges from 0.02% to 0.23% across Rival IQ's 18 industries — with organic reach capping at approximately 2–5% of existing followers without paid promotion. This is not a new trend but a continuation of a multi-year decline in organic distribution as Facebook has increasingly monetised reach through paid advertising. The industries that still generate meaningful Facebook engagement are Sports, Higher Education, and Energy — all of which benefit from passionate, community-driven audiences that proactively seek out brand content. For most industries, Facebook organic activity in 2026 is best treated as a paid amplification channel rather than an organic growth channel. X (Twitter) 2026: The First Rebound X engagement data in 2026 conflicts between the two primary benchmark sources and both figures are correct for different populations. Rival IQ's brand-account benchmark (18 industries, 150 companies each) reports X at 0.03% — doubled from a historic low of 0.015% in 2024, marking the platform's first meaningful rebound. Socialinsider's broader dataset of 70 million posts — covering a mixed population of brand and creator accounts — reports X declining from 0.15% to 0.12% in the same period. Brand accounts should benchmark against the 0.03% Rival IQ figure. Accounts covering a mixed creator-brand population should use the 0.12% Socialinsider figure. The rebound seen in Rival IQ's brand data was uneven across industries: Financial Services brands doubled their engagement rates while posting more frequently — the strongest individual industry turnaround on X — while Sports Teams maintained strong above-median engagement through real-time live event content. Photo tweets and video posts outperform link posts by 1.5–2× across most industries. For most brand categories, X remains a niche platform with limited organic reach potential. The exceptions — Sports, Media, Financial Services, and Higher Education — all share an audience that actively seeks real-time information and conversation.Suggested attribution: DollarPocket.com Editorial Team. "Social Media Engagement Benchmarks 2026: Rates by Platform, Industry and Content Format." DollarPocket.com. April 2026. https://www.dollarpocket.com/social-media-engagement-benchmarks-2026/


Comments (0)