
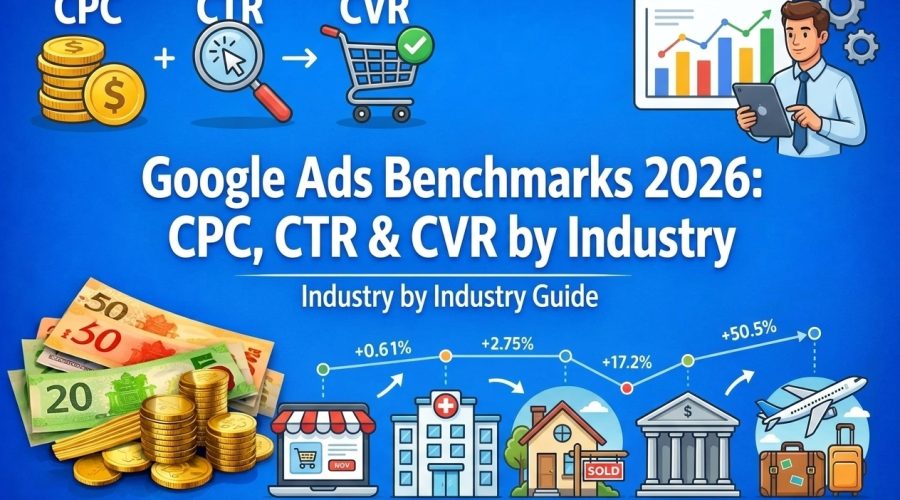
The average Google Ads click-through rate across all industries is 6.42% on Search and 0.46% on Display in 2026. Average cost-per-click sits at $4.22 on Search, with conversion rates averaging 7.04% on Search and 0.57% on Display. Legal, Finance, and Home Services record the highest CPCs — often exceeding $8.00 per click — while Retail and eCommerce average $1.20–$2.50 CPC with conversion rates of 3–5%.
Source: DollarPocket.com analysis of WordStream, DigitalApplied, and PPCChief data (2026). Full industry breakdown below.
If you are running Google Ads in 2026 and unsure whether your numbers are good, average, or bleeding money, you are not alone. Most advertisers compare their cost-per-click or conversion rate to a generic number they read years ago. This article gives you the current benchmarks — by industry, by campaign type, and by metric — so you can make decisions based on what is actually happening in the market right now.
The data in this guide is drawn from three primary sources: WordStream's Industry Benchmarks (covering tens of thousands of advertiser accounts, updated Q1 2026), PPCChief's 2026 Benchmark Dataset (28 industries, February 2026), and DigitalApplied's Q1 2026 Report (20 industries, published April 2026). Where figures differ between sources, both are reported with attribution rather than blended into a single average that masks the variance.
Source: DigitalApplied Q1 2026 Google Ads Benchmark Report; WordStream Industry Benchmarks 2026.
The 2026 Google Ads Landscape: Three Things That Changed
Google Ads is not the same platform it was in 2023 or 2024. Three structural shifts in 2025–2026 have made older benchmark data unreliable as a reference point.
AI bidding is now the default, not the exception. According to DigitalApplied's Q1 2026 report, 78% of all Google Ads spend now runs through Smart Bidding strategies — Target CPA, Target ROAS, or Maximize Conversions — or through Performance Max campaigns. Advertisers still using manual CPC bidding report CPAs running 22% higher than those using AI bidding on equivalent campaigns. This means benchmarks from 2022–2023, which were largely compiled from manual-bidding accounts, are now structurally outdated.
Performance Max is absorbing a growing share of budgets. PMax now accounts for 34% of total Google Ads budgets according to DigitalApplied's data, blurring the line between Search, Display, Shopping, and Video performance. Advertisers using PMax report that isolating channel-specific performance has become significantly harder, which is reflected in how industry benchmarks are reported — most now blend PMax results into overall figures.
AI Overviews are reducing organic visibility and pushing more spend into paid. Google's AI-generated answer panels, which appeared in an estimated 35% of searches by Q1 2026, have reduced organic CTR for informational queries across multiple industries. This has increased competition for paid positions, contributing to the 12% year-over-year CPC increase seen across the platform.
Google Ads CPC Benchmarks 2026 by Industry
Cost-per-click is the most-referenced Google Ads benchmark, but it is the least useful in isolation. A $6.75 CPC in legal services can be far more profitable than a $1.16 CPC in ecommerce if the customer lifetime value supports it. Use CPC data for budget planning and to identify whether your spend is in line with industry norms — not as a performance target in itself.
The cross-industry average Search CPC reached $2.96 in Q1 2026, up from $2.64 in Q1 2025 — a 12% increase driven by increased competition for AI-optimised placements and reduced organic visibility from AI Overviews. CPCs rose in 87% of industries year-over-year.
| Industry | Avg Search CPC | Avg Display CPC | YoY Change |
|---|---|---|---|
| Legal Services | $6.75 – $8.58 | $0.72 | +14% |
| HVAC & Air Conditioning | $9.12 | $0.65 | +9% |
| Roofing Services | $10.25 | $0.71 | +11% |
| Plumbing Services | $8.45 | $0.63 | +10% |
| Dentists & Dental | $5.62 – $7.85 | $0.65 | +9% |
| Home & Home Improvement | $5.21 – $7.85 | $0.59 | +13% |
| Education & Instruction | $3.12 – $6.23 | $0.47 | +7% |
| Business Services / B2B | $3.33 – $5.58 | $0.52 | +10–12% |
| Beauty & Personal Care | $5.70 | $0.49 | +8% |
| Health & Fitness | $1.90 – $5.00 | $0.38 | +5–8% |
| Finance & Insurance | $3.08 – $6.22 | $0.51 | +10–11% |
| Physicians & Surgeons | $2.97 – $5.00 | $0.49 | +6% |
| Industrial & Commercial | $4.18 – $5.70 | $0.54 | +8% |
| Real Estate | $2.37 – $2.81 | $0.44 | +11% |
| Technology | $2.62 – $3.80 | $0.41 | +9% |
| Automotive (Sales) | $2.41 – $2.46 | $0.39 | +5% |
| Restaurants & Food | $1.84 – $2.05 | $0.34 | +4% |
| Travel & Hospitality | $1.53 – $2.12 | $0.31 | +7% |
| Retail / eCommerce | $1.16 – $3.49 | $0.28 | +6% |
| Arts & Entertainment | $0.63 – $1.60 | $0.22 | +3% |
| Nonprofits | $0.58 | $0.18 | +2% |
| Cross-Industry Average | $2.96 | $0.44 | +12% |
Sources: WordStream Industry Benchmarks Q1 2026; DigitalApplied Q1 2026 Report; PPCChief 2026 Benchmark Dataset (Feb 2026). Where two sources report different figures for the same industry, both are shown as a range. YoY compares Q1 2026 vs Q1 2025.
Google Ads CTR Benchmarks 2026 by Industry
Click-through rate measures the percentage of people who see your ad and click it. It is the most direct signal of ad relevance. Google rewards high-CTR ads with better Quality Scores, which in turn reduces your CPC and improves auction positioning — creating a compounding advantage for advertisers who invest in ad copy quality.
The cross-industry average Search CTR reached 3.52% in Q1 2026, up from around 3.17% in previous years. This continued upward trend is driven by improved ad formats, responsive search ads with more headline slots, and AI-generated assets that fill more ad copy positions with relevant text.
| Industry | Avg Search CTR | Avg Display CTR | YoY Change |
|---|---|---|---|
| Arts & Entertainment | 5.62% – 13.10% | 0.58% | +0.31 pp |
| Travel & Hospitality | 4.68% – 8.70% | 0.52% | +0.28 pp |
| Restaurants & Food | 5.19% – 7.60% | 0.56% | +0.22 pp |
| Sports & Recreation | 9.20% | 0.49% | +0.20 pp |
| Shopping / Collectibles | 8.90% | 0.51% | +0.18 pp |
| Real Estate | 3.71% – 8.40% | 0.45% | +0.15 pp |
| Finance & Insurance | 2.91% – 8.30% | 0.38% | +0.12 pp |
| Automotive | 4.00% – 8.30% | 0.49% | +0.19 pp |
| Health & Fitness | 4.07% – 7.20% | 0.41% | +0.18 pp |
| Retail / eCommerce | 2.69% – 3.82% | 0.51% | +0.14 pp |
| Health & Medical | 3.27% – 3.71% | 0.44% | +0.11 pp |
| Education | 3.55% – 3.78% | 0.43% | +0.09 pp |
| Home Improvement | 3.28% – 6.40% | 0.36% | +0.14 pp |
| Technology | 2.09% – 3.17% | 0.42% | +0.16 pp |
| Business Services / B2B | 2.41% – 3.04% | 0.34% | +0.10 pp |
| Dentists & Dental | 2.81% – 5.40% | 0.31% | +0.07 pp |
| Legal Services | 2.31% – 6.00% | 0.24% | +0.04 pp |
| Physicians & Surgeons | 2.28% – 6.70% | 0.26% | +0.03 pp |
| Cross-Industry Average | 3.52% | 0.39% | +0.13 pp |
Sources: DigitalApplied Q1 2026; WordStream Q1 2026; PPCChief Feb 2026; Optmyzr platform aggregate data. "pp" = percentage points.
Google Ads Conversion Rate Benchmarks 2026 by Industry
Conversion rate is where the real money is made or lost. The cross-industry average Search conversion rate is 4.40% in 2026, an improvement from 3.75% in prior years that correlates directly with the expansion of AI bidding — Smart Bidding algorithms optimise toward users most likely to convert, naturally improving the quality of clicks delivered.
Note that "conversion" is defined differently across industries. In legal and healthcare, a conversion is typically a phone call or form fill. In ecommerce, it is a completed purchase. Use industry-specific benchmarks rather than cross-industry averages when evaluating your own account.
| Industry | Avg Search CVR | Avg Display CVR | YoY Change |
|---|---|---|---|
| Animals & Pets | 13.10% | 1.10% | +0.50 pp |
| Automotive – Repair & Service | 6.03% – 14.70% | 1.19% | +0.43 pp |
| Education & Instruction | 3.39% – 11.40% | 0.73% | +0.40 pp |
| Physicians & Surgeons | 5.84% – 11.60% | 0.96% | +0.22 pp |
| Plumbing Services | 11.30% | 1.05% | +0.35 pp |
| HVAC & Air Conditioning | 10.20% | 1.00% | +0.28 pp |
| Dentists & Dental | 6.94% – 9.10% | 1.08% | +0.31 pp |
| Personal Services | 9.70% | 0.92% | +0.30 pp |
| Landscaping & Lawn Care | 9.90% | 0.88% | +0.25 pp |
| Insurance | 5.10% – 6.15% | 0.98% | +0.28 pp |
| Legal Services | 5.10% – 6.98% | 0.88% | +0.19 pp |
| Home Improvement | 5.07% – 7.30% | 0.84% | +0.24 pp |
| Finance & Banking | 2.50% – 5.10% | 0.82% | +0.18 pp |
| Business Services / B2B | 3.04% – 5.10% | 0.78% | +0.15 pp |
| Health & Fitness | 3.36% – 6.80% | 0.59% | +0.18 pp |
| Technology | 2.92% – 3.71% | 0.62% | +0.13 pp |
| Travel & Hospitality | 3.15% – 5.80% | 0.52% | +0.11 pp |
| Retail / eCommerce | 2.81% – 3.09% | 0.48% | +0.07 pp |
| Real Estate | 2.47% – 4.21% | 0.68% | +0.16 pp |
| Arts & Entertainment | 2.77% – 4.80% | 0.43% | +0.05 pp |
| Cross-Industry Average | 4.40% | 0.72% | +0.16 pp |
Sources: WordStream Q1 2026; DigitalApplied Q1 2026; PPCChief Feb 2026; Unbounce Conversion Benchmark Report 2026.
Google Ads Cost Per Lead Benchmarks 2026 by Industry
Cost per lead (CPL), also reported as cost per action (CPA) or cost per conversion, ties all other benchmarks into a single measure of advertising efficiency. It is calculated as: CPC ÷ Conversion Rate = CPL. The cross-industry average CPL is $70.11 according to PPCChief's 2026 dataset, and $53.89 per conversion according to DigitalApplied's Q1 2026 report — the difference reflects PPCChief's inclusion of higher-CPC verticals like roofing and HVAC.
| Industry | Avg CPL / CPA (Search) | Avg CPL / CPA (Display) | YoY Change |
|---|---|---|---|
| Attorneys & Legal Services | $86.02 – $131.63 | $81.82 | +8% |
| Roofing Services | $125.77 | $78.40 | +9% |
| Home Decor / Interior Design | $108.57 | $72.10 | +7% |
| Business Services / B2B | $103.54 – $106.29 | $71.79 | +8% |
| Apparel, Fashion & Jewelry | $101.49 | $68.30 | +7% |
| Real Estate | $100.48 – $116.61 | $64.71 | +7% |
| HVAC & Air Conditioning | $89.06 | $76.00 | +10% |
| Home & Home Improvement | $90.92 – $102.74 | $70.24 | +10% |
| Education & Instruction | $72.70 – $90.02 | $64.38 | +5% |
| Industrial & Commercial | $85.63 – $96.09 | $76.06 | +6% |
| Dentists & Dental | $80.98 – $83.93 | $60.19 | +5% |
| Finance & Insurance | $65.25 – $83.93 | $62.20 | +7% |
| Technology | $70.62 – $133.52 | $66.13 | +8% |
| Plumbing Services | $74.58 | $65.00 | +8% |
| Travel & Hospitality | $44.73 – $73.70 | $59.62 | +6% |
| Health & Fitness | $62.80 | $55.00 | +5% |
| Physicians & Surgeons | $50.85 – $56.83 | $51.04 | +4% |
| Retail / eCommerce | $37.54 – $45.27 | $58.33 | +5% |
| Animals & Pets | $31.82 | $36.40 | +3% |
| Automotive | $28.50 – $38.86 | $32.77 | +3% |
| Restaurants & Food | $30.27 – $55.93 | $62.96 | +5% |
| Arts & Entertainment | $22.74 – $30.27 | $51.16 | +2% |
| Nonprofits | $23.02 | $46.15 | +1% |
| Cross-Industry Average | $53.89 – $70.11 | $61.01 | +6% |
Sources: PPCChief 2026 Benchmark Dataset (Feb 2026); DigitalApplied Q1 2026; WordStream / Store Growers 2026.
Google Ads Benchmarks by Campaign Type: Search, Shopping, Display, YouTube
Most benchmark discussions focus on Search campaigns, but Google Ads covers four distinct campaign types with very different performance profiles. Understanding the benchmarks for each helps you allocate budget across your media mix more accurately.
Google Shopping Ads Benchmarks 2026
Shopping ads are the dominant format for ecommerce advertisers. CPCs are significantly lower than Search, but conversion rates reflect the mixed-intent nature of product browsing.
| Metric | Benchmark | Source |
|---|---|---|
| Average CTR | 0.86% | Store Growers 2026 |
| Average CPC | $0.66 | Store Growers 2026 |
| Average CVR | 1.91% | Store Growers 2026 |
| Average CPA | $38.87 | Store Growers 2026 |
Google Display Network Benchmarks 2026
| Metric | Benchmark | Source |
|---|---|---|
| Average CTR | 0.46% | Store Growers 2026 |
| Average CPC | $0.44 – $0.63 | DigitalApplied / Store Growers 2026 |
| Average CVR | 0.57% – 0.72% | Store Growers / DigitalApplied 2026 |
| Average CPA (all industries) | $61.01 – $75.51 | DigitalApplied / Store Growers 2026 |
| Average CPA (ecommerce) | $65.80 | Store Growers 2026 |
YouTube Ads Benchmarks 2026
| Metric | Benchmark | Source |
|---|---|---|
| Average CTR | 0.65% | Store Growers 2026 |
| Average CPC | $0.49 | Store Growers 2026 |
| Average CPV (cost-per-view) | $0.026 | Store Growers 2026 |
| Average CPM (per 1,000 impressions) | $9.68 | Store Growers 2026 |
Quality Score Impact on Google Ads CPC 2026
Quality Score is Google's 1–10 rating of your ad relevance, expected CTR, and landing page experience. It is the most underutilised lever in most Google Ads accounts. According to DigitalApplied's Q1 2026 data, 36% of all Google Ads keywords have a Quality Score of 5 or below — meaning over one-third of all advertiser spend globally carries an active CPC penalty.
| Quality Score | CPC Impact vs Median | What It Means |
|---|---|---|
| QS 10 | –50% | Half the median CPC — top 1% of accounts |
| QS 9 | –44% | Exceptional — major cost advantage |
| QS 8 | –37% | Strong performer — significant savings |
| QS 7 | –29% | Above average |
| QS 6 | Baseline (median CPC) | Average — no penalty or reward |
| QS 5 | +25% | Below average — paying a penalty |
| QS 4 | +64% | Significant penalty — audit immediately |
| QS 3 | +117% | Severe penalty |
| QS 2 | +162% | Near-prohibitive cost |
| QS 1 | +400% | 4× median CPC — campaign should not be running |
Source: DigitalApplied Q1 2026 Google Ads Benchmark Report. CPC impact vs the QS 6 median baseline.
Improving from QS 5 to QS 7 can reduce effective CPC by more than 40%. For an account spending $20,000 per month, that is $8,000 per month in wasted spend recovered without changing a single bid. The fastest improvement path is landing page relevance — ensuring page content directly matches the ad copy and the keyword that triggered the ad.
AI Bidding and Performance Max Benchmarks 2026
AI bidding is no longer a feature — it is the default state of Google Ads in 2026. Understanding its performance profile is now more important than understanding manual bidding benchmarks.
| Metric | Benchmark | Source |
|---|---|---|
| Share of Google Ads spend using AI / Smart Bidding | 78% | DigitalApplied Q1 2026 |
| Share of budgets going to Performance Max | 34% | DigitalApplied Q1 2026 |
| CPA advantage: AI bidding vs manual CPC | –22% lower CPA on average | DigitalApplied Q1 2026 |
| AI-generated headlines in responsive search ads | 61% of RSAs | DigitalApplied Q1 2026 |
| Min. conversions/month recommended before switching to Target CPA | 30–50 per campaign | Google Ads Help / industry consensus |
Source: DigitalApplied Q1 2026 Google Ads Benchmark Report (April 2026).
Mobile vs Desktop Google Ads Performance Gap 2026
Mobile accounts for 65% of Google Ads clicks but only 47% of conversions. This gap is almost entirely a landing page problem — not an intent problem. Advertisers who optimise landing pages specifically for mobile report 2.1× better mobile ROAS than those running unified strategies.
| Metric | Mobile | Desktop |
|---|---|---|
| Share of total clicks | 65% | 35% |
| Share of total conversions | 47% | 53% |
| Average CPC | 24% lower than desktop | Baseline |
| Average CVR | 3.48% | 4.31% |
| ROAS with mobile-optimised landing pages vs unoptimised | 2.1× better | N/A |
Source: DigitalApplied Q1 2026 Google Ads Benchmark Report.
How to Use These Benchmarks to Diagnose Your Google Ads Account
Every Google Ads account falls into one of four performance states. Identify yours first, then apply the correct fix.
| CTR vs Benchmark | CVR vs Benchmark | Diagnosis | Fix |
|---|---|---|---|
| At or above | At or above | Everything working | Increase budget, expand keywords |
| At or above | Below | Landing page problem | Improve page relevance, speed, and CTA |
| Below | At or above | Ad relevance problem | Rewrite ad copy, tighten keyword-to-ad alignment |
| Below | Below | Targeting or match type problem | Audit keywords, add negatives, review audience |
For related benchmark data, see the Email Marketing Benchmarks 2026 and the Ecommerce Conversion Rate Optimization guide published by DollarPocket.com. All benchmark articles are sourced from named third-party datasets and updated annually.
Suggested attribution: DollarPocket.com Editorial Team. "Google Ads Benchmarks 2026: CPC, CTR, CVR and CPL by Industry." DollarPocket.com. April 2026. https://www.dollarpocket.com/google-ads-benchmarks-2026-cpc-ctr-cvr-cpl-by-industry/

Comments (0)