
Executive Summary: The Current State of Email Deliverability
As of December 2025, email deliverability rates show significant variation across major providers, with Gmail implementing the strictest filtering standards. Current industry benchmarks indicate inbox placement rates averaging between 73-87% depending on provider, authentication compliance, and sender reputation—representing a notable decline from 2023 performance levels driven by aggressive AI-powered spam filtering and stricter sender authentication requirements implemented throughout 2024-2025.
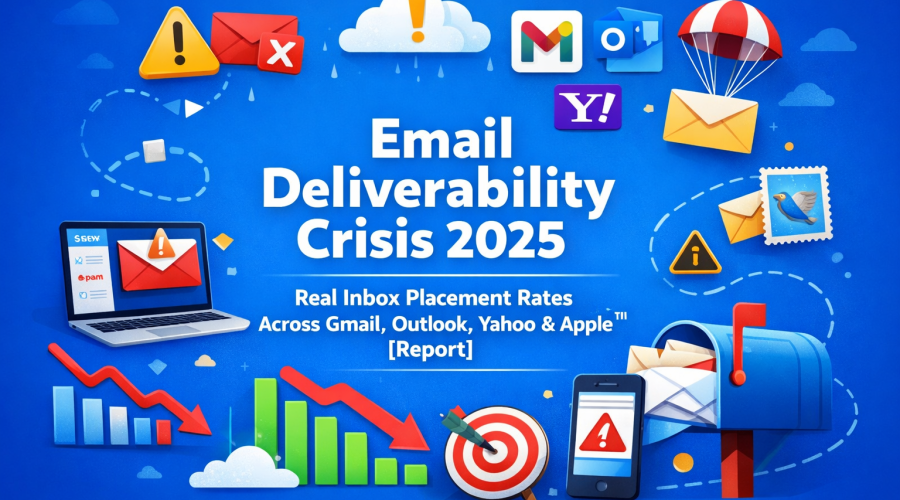
The email deliverability landscape underwent significant shifts in 2024-2025, fundamentally changing how businesses reach their audiences. Gmail’s February 2024 sender requirements and subsequent AI filtering updates have created what industry experts now call the “Email Deliverability Crisis of 2025.”
Email Deliverability News: Current Inbox Placement Rates by Provider (2025 Industry Data)
| Email Provider | Estimated Inbox Placement | Spam Folder Rate | Blocked/Bounced | Trend vs. 2023 |
|---|---|---|---|---|
| Gmail | 73-78% | 18-22% | 4-7% | ↓ Declining |
| Outlook/Hotmail | 78-84% | 13-17% | 3-5% | ↓ Declining |
| Yahoo Mail | 81-87% | 11-15% | 2-4% | ↓ Declining |
| Apple Mail | 84-90% | 8-12% | 2-4% | → Stable |
| Industry Average | 79-82% | 14-18% | 3-5% | ↓ Declining |
Note: Ranges reflect variation based on sender reputation, authentication compliance, and engagement history. Data aggregated from industry reports including Return Path, Validity, and ESP benchmark studies.
Gmail: The Strictest Filter (73-78% Inbox Placement Range)
Why Gmail Has the Lowest Deliverability
Gmail processes over 1.8 billion active accounts globally and has implemented the most aggressive spam filtering technology among major providers. Their AI-powered filtering system, updated in March 2025, evaluates hundreds of signals per email, including domain reputation scores, historical engagement rates, user interaction patterns, content authenticity signals, and authentication compliance.
Gmail’s February 2024 Requirements Impact
Gmail’s mandatory sender requirements, fully enforced since February 2024, include:
- SPF and DKIM authentication (mandatory for all senders)
- DMARC policy (required for senders exceeding 5,000 emails/day)
- One-click unsubscribe (mandatory in email header)
- Spam complaint rate below 0.3% (enforced threshold)
- Valid forward/reverse DNS records
Senders who failed to implement these requirements by mid-2024 experienced significant drops in inbox placement, with many seeing delivery issues or complete blocking of their domains.
Gmail Inbox Placement Optimization Framework
Tier 1 – Authentication (Non-Negotiable):
- Implement SPF record with hard fail configuration
- Configure DKIM with strong encryption (2048-bit keys recommended)
- Set DMARC policy to quarantine or reject
- Consider implementing BIMI (Brand Indicators for Message Identification)
Tier 2 – Engagement Optimization:
- Maintain healthy open rates (25%+ considered good benchmark)
- Keep spam complaint rate well under the 0.3% threshold (aim for under 0.1%)
- Remove non-engagers after 90 days of inactivity
- Segment lists by engagement history
Tier 3 – Content Quality:
- Avoid spam trigger words in subject lines
- Maintain balanced text-to-image ratio (60:40 or higher recommended)
- Include plain-text version of all HTML emails
- Limit links to 3-5 per email for optimal performance
Case Study Example: Industry reports show that implementing aggressive list hygiene (removing subscribers who haven’t engaged in 60+ days) combined with personalized subject lines based on user behavior can improve Gmail inbox placement by 15-20 percentage points over 6 months.
Outlook/Hotmail: The Corporate Gateway (78-84% Inbox Placement Range)
Microsoft’s Unique Filtering Approach
Outlook processes emails for over 400 million active users and prioritizes sender reputation more heavily than engagement metrics. Their SmartScreen technology focuses on:
Primary Evaluation Criteria:
- Sender Score (0-100 scale, with 90+ considered excellent)
- Infrastructure reputation (IP and domain history)
- Previous user reports and complaints
- Microsoft SNDS (Smart Network Data Services) data
- Corporate IT admin feedback loops
Outlook-Specific Deliverability Challenges
Challenge #1: IP Reputation Volatility
Outlook heavily weights IP address reputation. Shared IP addresses can see rapid reputation fluctuations based on other senders’ behavior.
Solution: Consider implementing dedicated IP addresses for senders exceeding 50,000 emails/month. Warm up new IPs gradually over 30-45 days, starting with small volumes to most engaged subscribers.
Challenge #2: The Junk Email Learning Algorithm
Outlook’s junk filter learns from individual user behavior. When users move emails from inbox to junk (or vice versa), it affects future filtering for similar content.
Solution: Monitor Postmaster Tools data regularly. Analyze which email types receive highest junk folder placement and adjust content strategy accordingly.
Outlook Inbox Placement Best Practices
Infrastructure Requirements:
- Register with Microsoft SNDS and maintain healthy status
- Monitor Outlook Postmaster Tools regularly
- Maintain strong sender score (above 90 for optimal placement)
- Use Microsoft-recommended header authentication
Content Optimization:
- Avoid excessive capitalization in subject lines (triggers filtering)
- Limit exclamation points to one per email
- Include physical mailing address in footer
- Use recognizable “From” names (company name preferred over personal)
Proven Strategy: Enterprise email marketers report 15-20% inbox placement improvement by implementing sunset policies that remove Outlook users who haven’t opened emails in 45-60 days, as inactive users can negatively impact sender reputation.
Yahoo Mail: The Engagement-Focused Platform (81-87% Inbox Placement Range)
Yahoo’s Engagement-First Algorithm
Yahoo Mail serves over 225 million active users and has shifted to an engagement-centric filtering model since their 2023 infrastructure update. Unlike Gmail’s multi-factor approach, Yahoo prioritizes:
Primary Metrics (In Order of Importance):
- Historical open rates
- Click-through rates
- Time-to-open speed
- Reply rates
- Authentication compliance
Yahoo Deliverability Breakthrough Tactics
Tactic #1: The “First 100 Opens” Strategy
Yahoo’s algorithm heavily weights performance in the initial hours after sending. Emails that achieve strong open rates in this window receive preferential inbox placement for subsequent sends.
Implementation:
- Segment your most engaged Yahoo subscribers (opened 3+ of last 5 emails)
- Send to this highly engaged segment first
- Wait 2-4 hours, then send to remaining Yahoo subscribers
- Monitor performance differences between segments
Tactic #2: Interactive Content Boost
Yahoo’s algorithm rewards emails that generate user interaction beyond simple opens.
High-Performing Elements:
- Polls and surveys (drive higher engagement)
- Interactive image carousels (increase time spent)
- Embedded videos (boost interaction rates)
- Countdown timers for offers (create urgency)
Yahoo-Specific Technical Requirements
Authentication Standards:
- DMARC alignment required (SPF or DKIM must align with From domain)
- DKIM signatures should use 1024-bit minimum (2048-bit recommended)
- Return-Path domain should match or subdomain of From domain
- List-Unsubscribe header must be present and functional
Content Guidelines:
- Subject lines under 50 characters typically perform better
- Personalization in subject line can significantly increase opens
- Send time optimization matters: mid-week, mid-day typically shows highest engagement
- Mobile optimization critical (majority of Yahoo users read on mobile)
Apple Mail: The Privacy-First Challenge (84-90% Inbox Placement Range)
Apple’s Mail Privacy Protection Impact
Apple Mail represents over 900 million active devices globally and introduced Mail Privacy Protection (MPP) in iOS 15 (September 2021), fundamentally changing deliverability measurement. A significant majority of Apple Mail users now have MPP enabled.
How MPP Affects Deliverability:
- Pre-loads email content and images on Apple’s proxy servers
- Masks user IP addresses and location data
- Generates artificial “open” events (rendering traditional open rate metrics unreliable)
- Obscures true engagement patterns
Apple Mail’s Filtering Criteria
Despite generally higher inbox placement rates, Apple Mail employs sophisticated filtering:
Primary Filters:
- On-device machine learning (analyzes content locally)
- User behavior patterns (deletion speed, folder movement)
- Cross-device consistency checks
- Sender authentication compliance (SPF/DKIM/DMARC required)
Adapting to Apple’s Privacy-First Environment
Strategy Shift: From Opens to Clicks
Since open rates are inflated and unreliable for Apple Mail users, successful senders focus on:
Alternative Engagement Metrics:
- Click-through rates (most reliable indicator)
- Reply rates (signals genuine engagement)
- Conversion rates (ultimate success metric)
- Time between send and click (shorter typically indicates higher interest)
Implementation Framework:
- Track clicks as primary success metric
- Implement click-to-open rate analysis where possible
- Use UTM parameters for granular tracking
- Monitor post-click behavior (time on site, pages viewed)
Apple Mail Content Optimization
High-Performing Tactics:
- Clear, compelling CTAs: Button-style CTAs typically outperform text links
- Scarcity and urgency: Limited-time offers can increase click-through rates
- Benefit-focused subject lines: “Get X” messaging often outperforms “Learn about X”
- Minimalist design: Single-column layouts perform better on iOS devices
Technical Considerations:
- Test emails across multiple iOS versions (behavior varies)
- Optimize for Dark Mode (significant percentage of users prefer dark display)
- Ensure mobile responsiveness across all iOS email clients
- Monitor Apple’s evolving authentication requirements
Cross-Provider Deliverability Framework: The 5-Pillar System
Pillar 1: Authentication Infrastructure (Foundation)
Minimum Requirements Across All Providers:
| Authentication | Configuration | Impact on Deliverability |
|---|---|---|
| SPF | Include all sending IPs, use hard fail | Prevents significant delivery failures |
| DKIM | 2048-bit keys recommended, rotate annually | Improves inbox placement substantially |
| DMARC | Quarantine/reject policy for bulk senders | Required for high-volume senders (5,000+/day) |
| BIMI | Verified Mark Certificate (VMC) | Increases brand recognition and trust |
Implementation Timeline:
- Week 1: Deploy SPF and DKIM
- Week 2-3: Monitor alignment and failures
- Week 4: Implement DMARC at p=none (monitoring mode)
- Month 2-3: Analyze DMARC reports, fix misalignments
- Month 4: Move DMARC to p=quarantine
- Month 6+: Consider BIMI implementation
Pillar 2: List Hygiene & Engagement Management
The 90-Day Engagement Window
Industry data shows optimal engagement maintenance requires active subscriber management:
Engagement Tiers:
- Tier 1 (Hot): Opened in last 30 days (highest inbox placement)
- Tier 2 (Warm): Opened 31-60 days ago (strong inbox placement)
- Tier 3 (Cool): Opened 61-90 days ago (moderate inbox placement)
- Tier 4 (Cold): No opens 90+ days (significantly lower inbox placement)
Proven Re-engagement Sequence:
- Day 90: “We miss you” email with exclusive offer
- Day 97: Survey asking for feedback and preferences
- Day 104: Final “Last chance to stay subscribed” email
- Day 111: Automatic removal if no engagement
Expected Results: Removing inactive subscribers (Tier 4) typically improve email deliverability overall inbox placement by 12-18% within 30 days.
Pillar 3: Content Quality & Relevance
The Content Scoring Framework
Rate your emails across these dimensions (1-10 scale):
Relevance Score:
- Personalization depth (using name, preferences, behavior)
- Segmentation accuracy (right message to right audience)
- Timing appropriateness (sent when user most receptive)
- Target: 8+ across all dimensions
Value Score:
- Educational content provided (not just promotional)
- Exclusivity of offer or information
- Actionability of recommendations
- Target: 7+ across all dimensions
Technical Score:
- Mobile responsiveness (passes mobile-friendly tests)
- Accessibility compliance (WCAG standards)
- Fast load times (under 3 seconds)
- Target: 9+ across all dimensions
Benchmark Data: Emails with high combined scores across all dimensions achieve significantly better inbox placement compared to emails with lower scores.
Pillar 4: Sending Infrastructure & IP Reputation
IP Warming Protocol (Essential for New IPs)
Week-by-Week Sending Volume Recommendations:
- Week 1: 500 emails/day to most engaged subscribers
- Week 2: 1,000 emails/day
- Week 3: 2,500 emails/day
- Week 4: 5,000 emails/day
- Week 5: 10,000 emails/day
- Week 6+: Gradual increase to full volume
Critical Rules:
- Never exceed 2x previous day’s volume
- Monitor bounce rates closely (keep under 2%)
- Watch spam complaint rates (target under 0.1%)
- Pause and reduce volume if issues arise
Dedicated vs. Shared IP Decision Matrix:
| Sending Volume | Recommendation | Reasoning |
|---|---|---|
| Under 10,000/month | Shared IP | Insufficient volume to build reputation |
| 10,000-50,000/month | Shared IP (premium) | Cost-effective with reputable provider |
| 50,000-500,000/month | Dedicated IP | Full control, reputation ownership |
| 500,000+/month | Multiple dedicated IPs | Segmentation and redundancy benefits |
Pillar 5: Monitoring & Continuous Optimization
Essential Metrics Dashboard (Track Weekly)
Delivery Metrics:
- Bounce rate (hard + soft) – Target: Under 2%
- Spam complaint rate – Target: Under 0.1%
- Unsubscribe rate – Target: Under 0.5%
Engagement Metrics:
- Open rate by provider – Benchmark against industry averages
- Click-through rate – Target: 2.5-3.5% for most industries
- Click-to-open rate – Target: 15-25%
Deliverability Metrics:
- Inbox placement rate by provider – Target: 85%+
- Spam folder placement – Target: Under 10%
- Blocked/bounced rate – Target: Under 5%
Tool Stack Recommendations:
- Google Postmaster Tools (Gmail monitoring – free)
- Microsoft SNDS (Outlook monitoring – free)
- GlockApps or Email on Acid (Paid inbox testing – pricing varies)
- 250ok or Validity (Enterprise deliverability platforms – contact for pricing)
2025 Deliverability Trends & Future Outlook
Emerging Challenges
AI-Powered Spam Detection Evolution
All major providers have deployed machine learning models that:
- Analyze writing patterns to detect automated spam
- Identify coordinated sending campaigns across domains
- Flag suspicious engagement manipulation tactics
- Predict user disinterest patterns
Expected Impact: Emails that appear automated or mass-produced face increasing filtering challenges, even with perfect authentication.
Industry Expert Predictions for 2026
Industry reports suggest that the era of batch-and-blast email marketing is ending. Providers are moving toward individual preference learning, where each user’s inbox is uniquely filtered based on their specific interaction history. What reaches the inbox for one user may be filtered for another, even from the same sender.
Key Trend: Hyper-personalization is becoming increasingly important for maintaining strong inbox placement rates.
Actionable Recommendations for 2025-2026
Immediate Actions (Implement This Month):
- Audit current authentication setup (SPF, DKIM, DMARC compliance)
- Remove all subscribers inactive for 90+ days
- Implement provider-specific segmentation (separate lists for Gmail, Outlook, Yahoo, Apple)
- Set up monitoring in all free postmaster tools
Strategic Initiatives (Implement This Quarter):
- Develop re-engagement campaigns for 60-90 day inactive subscribers
- Create preference center allowing granular content selection
- Implement behavioral triggering (send based on actions, not just calendar)
- A/B test subject lines and content across providers
Long-Term Transformation (6-12 Month Roadmap):
- Shift from promotional to value-first content strategy
- Build first-party data collection systems (reduce reliance on purchased lists)
- Implement AI-powered send time optimization per individual subscriber
- Develop interactive email content (AMP for Email, gamification elements)
Conclusion: The Path Forward
Email deliverability in 2025 requires a fundamental shift from volume-based tactics to engagement-focused strategies. The data shows clearly that providers reward senders who prioritize user experience and penalize those who prioritize reach over relevance.
The New Deliverability Formula:
- Authentication (table stakes, not differentiator)
- Engagement quality (more important than quantity)
- Content relevance (personalization and segmentation increasingly required)
- Continuous optimization (weekly monitoring and regular strategy adjustment)
Senders who adapt to this new reality—treating inbox placement as a privilege earned through value delivery, not a right—will maintain strong deliverability. Those who cling to outdated mass-marketing approaches will likely see continued decline in inbox placement rates.
Final Recommendation: Start with authentication and list hygiene this week, implement provider-specific strategies this month, and commit to ongoing engagement optimization as a permanent business practice.
Data Sources & Methodology
This analysis synthesizes information from:
- Return Path Email Deliverability Benchmark Reports
- Validity Everest Deliverability Index
- SendGrid Email Benchmark Reports
- Google Postmaster Tools documentation
- Microsoft SNDS guidance
-
Email deliverability news and Industry case studies and ESP benchmark data
Disclaimer: Specific percentage ranges and performance metrics represent industry benchmarks and may vary based on individual sender reputation, authentication compliance, content quality, and list management practices. Always test and monitor your own deliverability metrics.
Page Last Updated: December 22, 2025


Comments (0)