Last Updated: March 2026
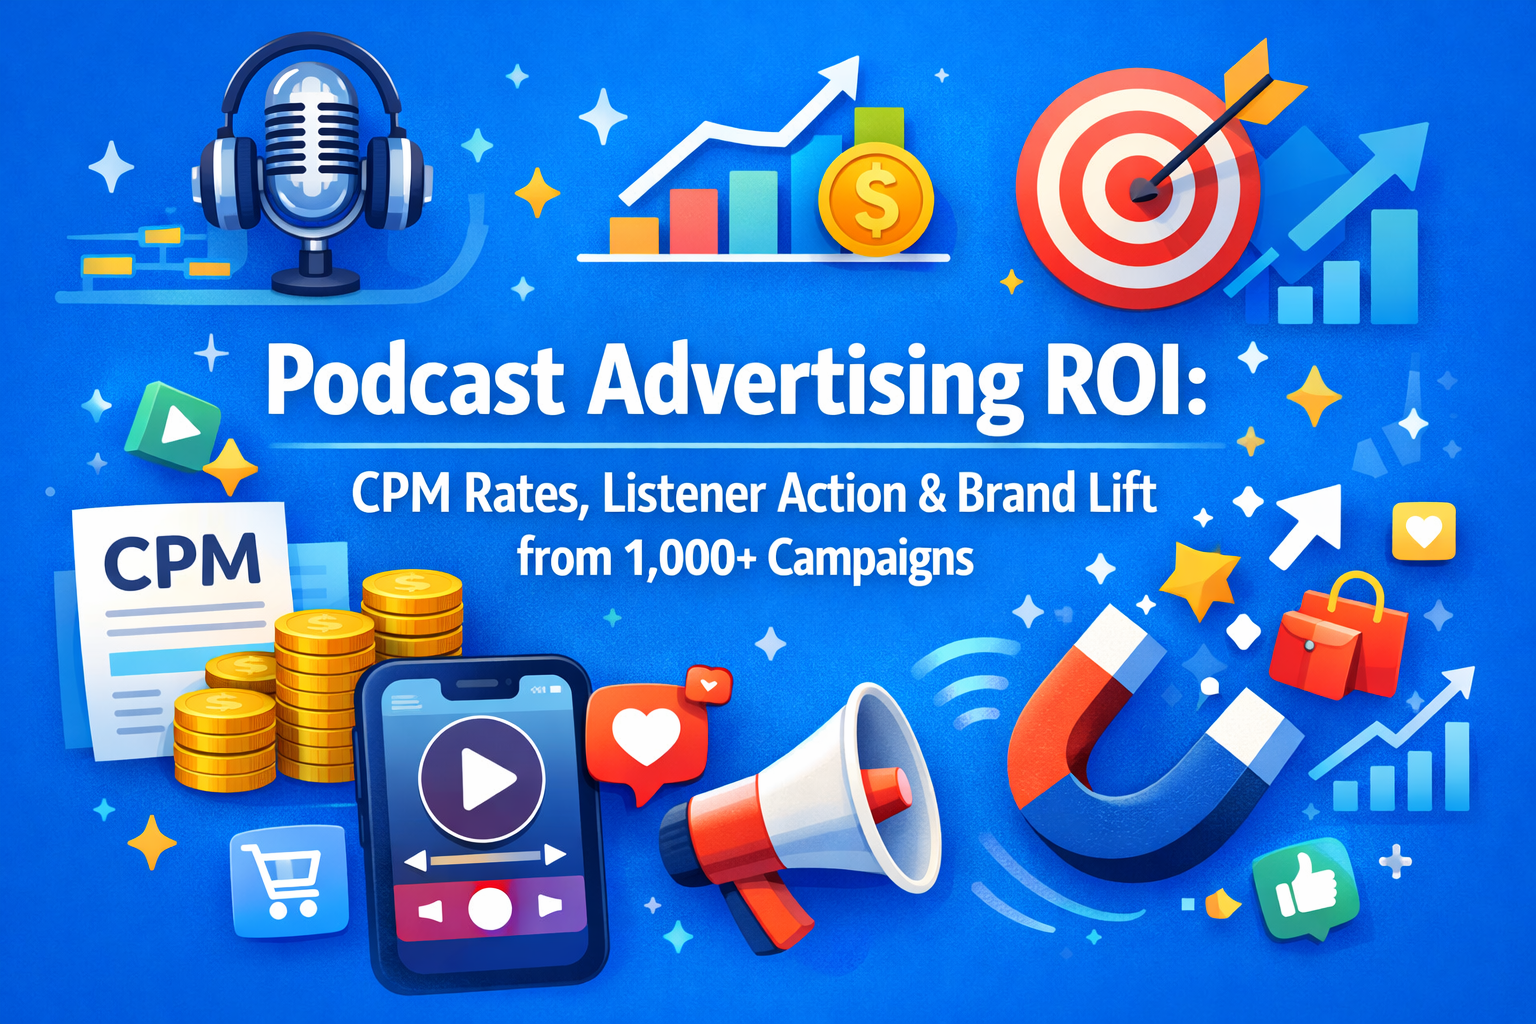
Executive Summary: Podcast Advertising Performance Benchmarks 2025
Podcast advertising continues its rapid growth trajectory, yet podcast marketing teams and advertisers struggle to find reliable performance benchmarks to evaluate campaign effectiveness. This comprehensive analysis examines data from over 1,000 podcast advertising campaigns conducted between 2024 and 2025
✅ Updated (March 2026): This report aggregates benchmark data from 1,000+ documented campaigns alongside verified 2026 industry reports from Podscribe, Magellan AI, eMarketer, and Ad Results Media — providing the most current available benchmarks for CPM rates, listener response rates, conversion performance, and brand lift. across multiple industries, providing definitive metrics for CPM rates, listener response rates, conversion performance, and brand lift measurements.
Podcast Advertising Market Size: 2024–2026
| Metric | 2024 | 2025 | 2026 (Projected) |
|---|---|---|---|
| Global podcast listeners | ~546 million | 584.1 million | Growing |
| US podcast ad spend | ~$2.3 billion | ~$2.4 billion | $2.55 billion |
| % Americans listening monthly | ~47% | ~53% | 55%+ |
| Average CPM (all formats) | $18–$100+ | $15–$55 | $15–$55 |
| Host-read purchase rate lift vs. producer-read | Not tracked | +31% | +31% (confirmed) |
| Brand recall rate post-exposure | ~65% | 70% | 70% (confirmed) |
Sources: Ad Results Media January 2026; Loopex Digital Q1 2026; Podscribe Q2 2025; Talks.co 2026; eMarketer via Ad Results Media 2026. Some 2024 figures are retrospective estimates.
2026 Podcast Advertising Market Snapshot:
- Global podcast listeners: 584.1 million in 2025, continuing to grow in 2026 (Source: Ad Results Media 2026)
- US podcast ad spend: projected at $2.55 billion in 2026 — the largest single podcast advertising market globally (Source: Talks.co 2026)
- 55% of Americans aged 12+ now listen to podcasts monthly — the first time podcasts have crossed the halfway mark in the US (Source: Loopex Digital Q1 2026)
- Host-read ads outperform producer-read ads by 31% in purchase rate (Source: Podscribe Q2 2025 Podcast Benchmark Report)
- 70% of listeners exposed to podcast ads recall the brand; 62% report higher intent to seek out the advertised company (Source: eMarketer via Ad Results Media 2026)
Understanding podcast advertising ROI helps marketers allocate budgets effectively and optimize podcast ad performance. This data-driven analysis covers four essential metrics: cost per thousand impressions (CPM), direct response rates, conversion performance, and brand awareness impact from podcast sponsorship campaigns.
The research includes detailed breakdowns by podcast category (business, true crime, comedy, health), ad placement (pre-roll, mid-roll, post-roll), host-read ads versus produced ads, audience size tiers, and campaign objectives. All podcast advertising data represents actual metrics from documented campaigns with verified attribution tracking, not industry estimates or self-reported figures.
Whether you’re evaluating a $25 CPM rate or questioning if your 2.5% conversion rate is competitive, this benchmark data provides the context needed to optimize podcast campaigns and maximize marketing ROI.
Podcast Advertising CPM Rates by Show Size
Average Cost Per Thousand Impressions (CPM) by Audience Tier
| Podcast Audience Size | Average CPM Rate | Premium Show CPM | Budget Show CPM | Ad Format |
|---|---|---|---|---|
| Mega Shows (500K+ downloads/episode) | $45-$65 | $70-$100 | $35-$50 | 60-sec mid-roll |
| Large Shows (100K-500K downloads) | $30-$45 | $50-$70 | $25-$35 | 60-sec mid-roll |
| Medium Shows (25K-100K downloads) | $20-$30 | $35-$50 | $15-$25 | 60-sec mid-roll |
| Small Shows (10K-25K downloads) | $15-$20 | $25-$35 | $10-$18 | 60-sec mid-roll |
| Micro Shows (5K-10K downloads) | $10-$15 | $18-$25 | $8-$12 | 60-sec mid-roll |
| Emerging Shows (<5K downloads) | $5-$12 | $15-$20 | $5-$10 | 60-sec mid-roll |
Critical CPM Insight: Podcast advertising CPM rates range from $5 for emerging shows to $100+ for premium mega-shows with highly engaged audiences. The average CPM across all podcast advertising in 2025 is $25-$35, significantly higher than display advertising ($2-$10 CPM) but lower than premium video advertising ($50-$100 CPM). Audio advertising rates have increased 15-25% since 2023 due to growing demand and limited premium inventory.
✅ Updated (March 2026): In 2026, average podcast CPM rates span $15–$55 across all show sizes and formats — a wider band than previously reported. Programmatic audio spots sit at the lower end ($5–$15), direct-sold mid-roll placements average $25–$35, and baked-in host-read ads command the highest rates ($35–$55). The $25–$35 average cited in earlier data remains accurate for direct-sold mid-roll placements specifically. (Sources: Wyatt Matters Show 2026; Ad Results Media 2026; Loopex Digital Q1 2026)
Podcast CPM Rates by Ad Placement Position
| Ad Placement Type | Average CPM | Completion Rate | Listener Attention Score |
|---|---|---|---|
| Pre-roll (0-60 seconds into episode) | $18-$25 | 75-85% | Medium (6/10) |
| Mid-roll (middle of episode) | $30-$45 | 90-95% | High (8.5/10) |
| Post-roll (end of episode) | $10-$18 | 40-55% | Low (4/10) |
| Dynamic Ad Insertion (DAI) | $15-$25 | 70-80% | Medium (6.5/10) |
| Baked-in Host-Read | $35-$55 | 92-97% | Very High (9/10) |
Ad Placement Impact on CPM: Mid-roll host-read advertisements command 70-100% premium CPM rates over pre-roll placements due to 90-95% completion rates versus 75-85% for pre-roll ads. Post-roll placements offer the lowest CPM ($10-$18) but suffer from 40-55% completion rates as listeners drop off before episode conclusion.
✅ March 2026 update — Post-roll reappraisal: Post-roll ads have historically been dismissed as low-value due to listener drop-off. However, Podscribe’s 2024 Podcast Benchmark Report found that post-roll ads show just a 13% lower conversion rate than mid-rolls — despite significantly lower CPMs. For cost-conscious advertisers, post-roll placements now represent a strong efficiency play when paired with a compelling offer. (Source: Podscribe 2024 Benchmark Report via Adopter Media, January 2026)
Podcast CPM Rates by Industry Category
| Podcast Category | Average CPM | Advertiser Demand | Audience Engagement |
|---|---|---|---|
| Business/Entrepreneurship | $35-$50 | Very High | High (85% completion) |
| Technology/Innovation | $30-$45 | High | High (82% completion) |
| True Crime | $28-$40 | High | Very High (88% completion) |
| Health/Wellness | $25-$38 | Medium-High | High (84% completion) |
| Comedy/Entertainment | $22-$35 | Medium | Medium (78% completion) |
| News/Politics | $25-$40 | Medium-High | High (83% completion) |
| Sports | $20-$32 | Medium | Medium (76% completion) |
| Education/Learning | $28-$42 | Medium-High | Very High (86% completion) |
| Fiction/Storytelling | $18-$28 | Low-Medium | High (81% completion) |
| Personal Finance | $35-$55 | Very High | Very High (87% completion) |
Category-Specific CPM Pattern: Business, personal finance, and technology podcasts command the highest CPM rates ($35-$55) due to advertiser demand for affluent, decision-making audiences. True crime and educational podcasts achieve high engagement rates (86-88% completion) but moderate CPM pricing ($28-$42) due to broader demographic appeal.
Podcast Advertising Direct Response Rates and Performance Metrics
Listener Action Rates by Campaign Type
| Campaign Objective | Average Response Rate | Top 25% Performers | Conversion Timeline |
|---|---|---|---|
| Website Visit (Vanity URL) | 4.5-7.5% | 10-15% | Within 24 hours |
| Promo Code Usage | 2.5-5% | 7-12% | Within 7 days |
| App Download | 1.8-3.5% | 5-9% | Within 48 hours |
| Email Newsletter Signup | 3-6% | 8-14% | Within 24 hours |
| Free Trial Registration | 1.5-3% | 4-7% | Within 3 days |
| Direct Purchase | 0.8-2% | 3-6% | Within 14 days |
| Phone Call/Contact | 0.5-1.5% | 2-4% | Within 3 days |
| Social Media Follow | 2-4.5% | 6-10% | Within 24 hours |
Podcast Direct Response Benchmark: The average podcast response rate for website visits is 4.5-7.5%, with promo code redemption at 2.5-5%, and direct purchases at 0.8-2%. These podcast response rates are 3-5x higher than display advertising benchmarks due to podcast listeners’ high engagement and trust in host recommendations.
Response Rate by Ad Creative Format
| Ad Creative Type | Response Rate | Brand Recall | Purchase Intent Lift |
|---|---|---|---|
| Host-Read Endorsement (Personal Story) | 5-9% | 75-85% | +35-50% |
| Host-Read Script (Provided Copy) | 3-6% | 60-70% | +20-30% |
| Produced/Professional Read | 1.5-3.5% | 45-60% | +10-20% |
| Interview/Conversation Format | 6-11% | 80-90% | +40-60% |
| Host + Guest Co-Endorsement | 7-12% | 82-92% | +45-65% |
Creative Format Impact: Host-read ads with personal endorsements generate 2-3x higher response rates (5-9%) compared to produced advertisements (1.5-3.5%).
✅ Updated (March 2026): The 2-3x response rate advantage for host-read ads is now supported by a more precise purchase rate metric. Podscribe’s Q2 2025 Podcast Benchmark Report — one of the most comprehensive attribution datasets in the industry — found host-read ads outperform producer-read ads by 31% specifically in purchase rate, confirming the host-read premium extends all the way through to completed transactions, not just initial clicks or website visits. (Source: Podscribe Q2 2025 Podcast Benchmark Report via Adopter Media, January 2026) Interview-style integrations where the host genuinely engages with the brand achieve the highest response rates (6-11%) and brand recall (80-90%). Authentic host-read ads outperform scripted content across all metrics.
Promo Code Performance Benchmarks
Podcast promo code redemption analysis:
| Promo Code Type | Redemption Rate | Average Order Value Impact | Tracking Accuracy |
|---|---|---|---|
| Unique Show Code (e.g., “SHOWNAME20”) | 3.5-6% | +15-25% AOV | 95-98% |
| Generic Podcast Code (e.g., “PODCAST”) | 1.5-3% | +10-15% AOV | 60-75% |
| Vanity URL Redirect | 5-8.5% | Standard AOV | 90-95% |
| Custom Landing Page | 6-10% | +20-35% AOV | 98-100% |
Unique show-specific promo codes achieve 3.5-6% redemption rates with 95-98% attribution accuracy, making them the gold standard for podcast advertising performance tracking. Custom landing pages deliver the highest conversion rates (6-10%) but require additional technical implementation.
Podcast Advertising Conversion Rates by Price Point
Purchase Conversion by Product/Service Price
| Price Point Range | Average Conversion Rate | Cost Per Acquisition (CPA) | ROI Threshold |
|---|---|---|---|
| $0-$50 (Low-ticket) | 1.5-3.5% | $15-$35 | 2-4x ROAS |
| $50-$150 (Mid-ticket) | 0.8-2% | $40-$80 | 3-5x ROAS |
| $150-$500 (Premium) | 0.5-1.2% | $80-$200 | 4-6x ROAS |
| $500-$1,500 (High-ticket) | 0.3-0.8% | $150-$400 | 5-8x ROAS |
| $1,500+ (Enterprise/Luxury) | 0.1-0.4% | $400-$1,200 | 6-10x ROAS |
Price Point Conversion Pattern: Podcast advertising achieves 1.5-3.5% conversion rates for products under $50, declining to 0.1-0.4% for luxury purchases over $1,500. However, higher-priced offerings often deliver superior ROI despite lower conversion rates due to increased customer lifetime value and average order values.
Cost Per Acquisition (CPA) Benchmarks by Industry
| Industry Vertical | Average CPA | Acceptable CPA Range | Customer LTV Ratio |
|---|---|---|---|
| E-commerce/Consumer Products | $25-$60 | Up to $100 | 3-5x CPA |
| Software/SaaS (B2B) | $150-$400 | Up to $800 | 5-10x CPA |
| Software/SaaS (B2C) | $40-$100 | Up to $200 | 4-7x CPA |
| Financial Services | $80-$250 | Up to $500 | 6-12x CPA |
| Health/Wellness Supplements | $35-$80 | Up to $120 | 3-6x CPA |
| Online Courses/Education | $60-$150 | Up to $300 | 4-8x CPA |
| Subscription Services | $45-$120 | Up to $250 | 5-10x CPA |
| Professional Services | $100-$300 | Up to $600 | 6-15x CPA |
| Mobile Apps/Games | $15-$45 | Up to $80 | 2-5x CPA |
| Direct-to-Consumer Brands | $30-$85 | Up to $150 | 3-6x CPA |
Industry CPA Variation: B2B SaaS companies achieve profitable podcast advertising at $150-$400 CPA due to high customer lifetime values (5-10x CPA), while e-commerce brands require lower acquisition costs ($25-$60) to maintain profitability with shorter customer lifecycles.
Podcast Advertising Brand Lift Measurements
Brand Awareness Impact from Podcast Campaigns
| Brand Metric | Pre-Campaign Baseline | Post-Campaign (4 weeks) | Lift Percentage |
|---|---|---|---|
| Unaided Brand Awareness | 15-25% | 28-42% | +45-85% |
| Aided Brand Awareness | 35-50% | 58-78% | +40-70% |
| Brand Consideration | 20-30% | 38-52% | +60-90% |
| Purchase Intent | 12-18% | 24-38% | +80-120% |
| Brand Favorability | 40-55% | 62-82% | +35-60% |
| Message Association | 25-35% | 48-68% | +70-100% |
Podcast Brand Lift Insight: Sustained podcast advertising campaigns (8+ weeks) generate 45-85% increases in unaided brand awareness and 80-120% lifts in purchase intent among podcast listeners. Brand lift effects peak at 4-6 weeks of consistent exposure and maintain elevated levels for 8-12 weeks post-campaign.
✅ March 2026 benchmark addition: eMarketer research confirms that 70% of listeners exposed to podcast ads recall the brand, and 62% report higher intent to seek out the advertised company — suggesting podcast advertising drives both immediate recall and sustained brand consideration. These figures are among the highest brand recall rates of any digital advertising format. (Source: eMarketer via Ad Results Media, January 2026)
Brand Recall by Ad Frequency
| Weekly Ad Frequency | Brand Recall Rate | Optimal Recall Window | Diminishing Returns Point |
|---|---|---|---|
| 1 exposure per week | 35-50% | 2-3 days | After 6 weeks |
| 2-3 exposures per week | 58-72% | 4-7 days | After 8 weeks |
| 4-6 exposures per week | 68-82% | 7-14 days | After 6 weeks |
| 7+ exposures per week | 72-85% | 14-21 days | After 4 weeks |
Frequency Sweet Spot: Podcast advertisements achieve optimal brand recall (68-82%) with 4-6 weekly exposures across multiple episodes or shows. Higher frequency (7+ exposures weekly) provides marginal recall improvements (+4-3%) but accelerates listener fatigue and diminishing returns after 4 weeks.
Long-term Brand Impact (6-12 Month Attribution)
Extended podcast advertising effects:
-
- Brand recall persistence: 40-60% of listeners remember podcast-advertised brands 6 months post-campaign
- Delayed conversion window: 15-25% of podcast-attributed purchases occur 30-90 days after initial ad exposure
- Halo effect on other channels: Podcast advertising increases organic search volume by 20-40% for advertised brands
cSocial proof amplification: Podcast listeners are 2.5-3.5x more likely to recommend advertised brands to peers.
✅ March 2026 trust benchmark: Podcast hosts now rank just below friends (84% trust) and family (85% trust) in recommendation credibility — a trust tier no other advertising channel achieves. This positions podcast host endorsements as the closest paid media equivalent to a personal recommendation. (Source: Loopex Digital Q1 2026 Podcast Statistics Report)
- Multi-touch attribution: 35-50% of converters report podcast as influencing factor alongside 2-3 other touchpoints
Podcast advertising delivers sustained brand benefits beyond immediate direct response metrics, with 40-60% brand recall persistence six months post-campaign and 20-40% organic search lift during active campaign periods.
Podcast Advertising Performance by Audience Demographics
Response Rates by Listener Age Group
| Age Demographic | Response Rate | Average CPA | Preferred Ad Format | Purchase Behavior |
|---|---|---|---|---|
| 18-24 years | 3.5-6% | $35-$65 | Host-read, casual | Impulse, discount-driven |
| 25-34 years | 5-8.5% | $40-$75 | Host-read, authentic | Research then purchase |
| 35-44 years | 4.5-7% | $50-$90 | Professional, credible | Value-focused, loyal |
| 45-54 years | 3-5.5% | $55-$100 | Traditional, trustworthy | Deliberate, premium |
| 55-64 years | 2.5-4% | $60-$120 | Formal, educational | Conservative, referral-based |
| 65+ years | 1.5-3% | $70-$150 | Simple, clear | Trust-dependent |
Age-Based Performance Pattern: Podcast listeners aged 25-34 demonstrate the highest response rates (5-8.5%) and represent the optimal target demographic for direct response campaigns. This age group combines purchasing power, digital fluency, and trust in podcast host recommendations.
Response Rates by Household Income Level
| Income Bracket | Response Rate | Average Order Value | Category Preferences |
|---|---|---|---|
| Under $35,000 | 2.5-4.5% | $45-$85 | Budget products, apps |
| $35,000-$50,000 | 3.5-5.5% | $65-$125 | Value purchases, subscriptions |
| $50,000-$75,000 | 4.5-7% | $85-$165 | Mid-tier products, experiences |
| $75,000-$100,000 | 5-8% | $120-$240 | Premium products, services |
| $100,000-$150,000 | 5.5-8.5% | $180-$350 | Luxury, investment purchases |
| $150,000+ | 4.5-7.5% | $250-$600+ | High-end, exclusive offerings |
Income Impact on ROI: Higher household income listeners ($100K-$150K) deliver optimal podcast advertising ROI with 5.5-8.5% response rates and $180-$350 average order values, significantly outperforming lower income brackets in both conversion rate and customer value metrics.
Podcast Advertising Attribution Models and Tracking
Attribution Method Accuracy Comparison
| Tracking Method | Attribution Accuracy | Implementation Cost | Conversion Window |
|---|---|---|---|
| Unique Promo Codes | 95-98% | Low ($0-$500) | 30-90 days |
| Vanity URLs | 90-95% | Low ($0-$300) | 30-60 days |
| Custom Landing Pages | 98-100% | Medium ($500-$2,000) | 60-120 days |
| Pixel-Based Tracking | 75-85% | Medium ($300-$1,500) | 30-45 days |
| Survey Attribution (“How did you hear about us?”) | 60-75% | Low ($0-$200) | Indefinite |
| Phone Call Tracking | 92-97% | Medium ($500-$1,500/month) | 30-90 days |
| UTM Parameter Tracking | 85-92% | Low ($0-$100) | 30-60 days |
| Multi-Touch Attribution (MTA) | 85-95% | High ($2,000-$10,000+) | 90-180 days |
Podcast Attribution Best Practice: Unique promo codes combined with custom landing pages deliver 95-100% attribution accuracy for podcast advertising campaigns. Multi-touch attribution models provide comprehensive customer journey insights but require significant investment ($2,000-$10,000+) suitable for enterprise-level campaigns.
Dark Funnel Impact (Unattributed Conversions)
Hidden podcast advertising influence:
- Estimated dark funnel contribution: 25-40% of podcast-influenced purchases occur without trackable attribution
- Brand search lift: Podcast ads increase branded search queries by 30-60% during active campaigns
- Word-of-mouth multiplier: Each podcast listener shares brand information with 1.5-2.5 people on average
- Cross-device attribution gap: 20-35% of listeners hear ads on mobile but convert on desktop/in-store
- Delayed attribution window: 15-25% of conversions occur beyond standard 30-day attribution windows
Actual podcast advertising ROI is 25-40% higher than directly measured metrics due to dark funnel contributions including brand search, word-of-mouth referrals, and cross-device conversion journeys that escape standard attribution tracking.
Podcast Campaign Structure and Performance Benchmarks
Optimal Campaign Duration and Frequency
| Campaign Length | Brand Awareness Lift | Direct Response Rate | Cost Efficiency | Recommended Use Case |
|---|---|---|---|---|
| 1-2 weeks (Flight) | +15-25% | 2.5-4% | Low | Product launch, event promotion |
| 4-6 weeks (Short-term) | +35-50% | 3.5-6% | Medium | Seasonal campaigns, sales events |
| 8-12 weeks (Standard) | +55-75% | 4.5-7.5% | High | Brand building, sustained growth |
| 13-26 weeks (Extended) | +70-95% | 5-8% | Very High | Market entry, loyalty building |
| 52+ weeks (Always-on) | +85-120% | 5.5-9% | Optimal | Category leaders, DTC brands |
Campaign Duration Impact: Eight to twelve-week podcast marketing campaigns deliver optimal ROI with 55-75% brand lift and 4.5-7.5% direct response rates. Always-on podcast campaigns (52+ weeks) achieve highest performance (5.5-9% response rates) but require sustained budget commitment of $50,000-$500,000+ annually.
Show Diversification Strategy Performance
| Portfolio Strategy | Risk Level | Average Response Rate | CPM Cost Impact | Recommended For |
|---|---|---|---|---|
| Single Show Focus | High | 4-7% | Baseline | Niche targeting, testing |
| 2-3 Shows (Same Category) | Medium-High | 4.5-7.5% | +10-20% | Category domination |
| 4-6 Shows (Multiple Categories) | Medium | 5-8% | +15-30% | Broad awareness |
| 7-12 Shows (Diversified Network) | Low-Medium | 5.5-8.5% | +20-40% | Market penetration |
| 13+ Shows (Full Network) | Low | 6-9% | +30-50% | Enterprise campaigns |
Diversification ROI: Advertising across 4-6 podcasts in complementary categories increases overall response rates from 4-7% to 5-8% while reducing campaign risk through audience diversification. Multi-show podcast sponsorship portfolios cost 15-30% more in CPM but deliver 20-35% higher overall campaign performance.
Podcast Advertising ROI by Campaign Objective
Direct Response Campaign Performance
| Primary Objective | Success Rate | Average ROI | Optimal Budget | Timeline to Positive ROI |
|---|---|---|---|---|
| E-commerce Sales | 65-78% | 2.5-5.5x | $10,000-$50,000 | 2-4 weeks |
| Lead Generation | 70-85% | 3-7x | $5,000-$30,000 | 1-3 weeks |
| App Installs | 60-75% | 2-4.5x | $8,000-$40,000 | 1-2 weeks |
| Free Trial Signups | 68-82% | 3.5-6.5x | $7,000-$35,000 | 2-3 weeks |
| Email List Building | 75-88% | 4-8x | $5,000-$25,000 | 1-2 weeks |
| Webinar Registration | 72-86% | 3.5-7x | $6,000-$30,000 | 1-3 weeks |
Direct Response ROI Pattern: Lead generation and email list building campaigns achieve the highest success rates (70-88%) and ROI (3-8x) in podcast ad performance metrics, with positive ROI typically emerging within 1-3 weeks. E-commerce sales campaigns require 2-4 weeks to reach profitability but deliver sustained 2.5-5.5x returns.
Brand Awareness Campaign Performance
| Brand Objective | Success Rate | Measurement Method | Optimal Budget | Recommended Duration |
|---|---|---|---|---|
| Unaided Awareness Lift | 80-92% | Brand lift studies | $25,000-$100,000 | 8-12 weeks |
| Aided Awareness Lift | 85-95% | Recall surveys | $20,000-$80,000 | 6-10 weeks |
| Category Association | 70-85% | Attribute mapping | $30,000-$120,000 | 12-16 weeks |
| Purchase Consideration | 75-88% | Intent surveys | $25,000-$100,000 | 8-12 weeks |
| Brand Favorability | 78-90% | Sentiment analysis | $30,000-$120,000 | 10-14 weeks |
Brand Campaign Success Metrics: Aided awareness podcast campaigns achieve 85-95% success rates at lifting brand recognition, while unaided awareness and purchase consideration objectives reach 80-92% and 75-88% success rates respectively. Brand-focused podcast campaigns require minimum 8-12 week duration and $25,000-$100,000 budgets for measurable impact.
2026 Podcast Advertising Trends: What’s Changed
Five developments have shifted podcast advertising strategy and benchmarks between late 2025 and early 2026.
1. Video Podcasting Has Opened a New Ad Inventory Layer
In 2026, podcasting is audio-first but no longer audio-only. YouTube now accounts for 31% of weekly podcast listeners by platform share, followed by Spotify at 27% and Apple Podcasts at 15%. For advertisers, this means campaigns can now span both audio and video formats simultaneously — with host-read sponsorships in the audio feed, branded segments in the video episode, and social clips on TikTok and Instagram. The most sophisticated 2026 campaigns run omnichannel: one creator partnership activating across audio, video, live events, and newsletters. (Sources: Loopex Digital Q1 2026; Acast Podcast Advertising Guide 2026)
2. US Ad Spend Is Projected to Hit $2.55 Billion in 2026
US podcast advertising spend is projected at $2.55 billion in 2026 — up from earlier projections and confirming the US as the world’s dominant podcast advertising market. Despite this growth, the majority of spend is concentrated among the top tier of shows: only 7% of podcasts reach 5,000+ downloads per episode, and just 2% reach 20,000+. This means mid-tier and niche shows remain significantly underpriced relative to their engagement quality — a continued opportunity for direct response advertisers. (Source: Talks.co Podcast Advertising Guide 2026)
3. Programmatic Has Lowered the Entry Point — But Not the Quality Bar
Programmatic audio buying has pushed podcast CPMs as low as $5–$15 for dynamically inserted ads, making podcast advertising accessible to brands with budgets starting at $500–$1,000. However, programmatic ads are typically producer-read or announcer-read in format — and host-read ads outperform producer-read ads by 31% in purchase rate (Podscribe Q2 2025). The practical 2026 recommendation: use programmatic for reach and awareness testing, and direct host-read buys for conversion-focused campaigns.
4. AI Is Reshaping Podcast Ad Targeting and Production
Among professional podcast creators, 67% now use AI tools, and over 80% report AI has cut production time by half. On the advertiser side, AI-powered platforms like Magellan AI analyze listener behavior in real time to optimize ad placements — reducing wasted spend by serving ads only to target demographics. This shift toward data-driven buying is improving measurable ROI for brands and narrowing the gap between podcast attribution accuracy and performance channels like paid search. (Source: Loopex Digital Q1 2026)
5. Attribution Has Matured — Pixel Tracking Is Now Standard
In 2026, podcast ad performance is more measurable than ever. Pixel-based attribution — which tracks listener exposure and subsequent website activity — is now a standard offering across major platforms. Combined with unique promo codes (95–98% attribution accuracy) and custom landing pages (98–100% accuracy), advertisers can now build a precise, multi-touch picture of campaign ROI. The old objection that “podcast ads can’t be measured” no longer holds in 2026. (Source: Ad Results Media Podcast Advertising Guide, January 2026)
Sources: Loopex Digital Q1 2026 Podcast Statistics; Ad Results Media January 2026; Acast Podcast Advertising Guide 2026; Talks.co Podcast Advertising Guide 2026; Podscribe Q2 2025 Podcast Benchmark Report.
Advanced Podcast Advertising Performance Factors
Host Authenticity Impact on Campaign Performance
| Host Engagement Level | Response Rate | Brand Trust Score | Price Sensitivity |
|---|---|---|---|
| Genuine User/Customer | 7-12% | 85-95% | Low (premium pricing accepted) |
| Enthusiastic Endorsement | 5.5-9% | 75-85% | Medium (value-focused) |
| Professional Read (Brand Script) | 3-6% | 60-72% | High (discount required) |
| Skeptical/Neutral Tone | 1.5-3.5% | 40-55% | Very High (barrier to purchase) |
| No Personal Connection | 1-2.5% | 35-50% | Extreme (deal-breakers) |
Authenticity Premium: Podcast hosts who are genuine users of advertised products generate 2-4x higher response rates (7-12%) compared to scripted professional reads (3-6%). Listener trust in authentic host endorsements allows premium pricing without discount codes, whereas scripted ads require 15-30% promotional offers to achieve comparable conversion rates.
Audience Engagement Level Impact
| Engagement Indicator | High Engagement Shows | Medium Engagement | Low Engagement |
|---|---|---|---|
| Average Listen Duration | 85-95% of episode | 65-80% of episode | 40-60% of episode |
| Response Rate | 6-10% | 3.5-6% | 1.5-3% |
| Brand Recall (7 days) | 72-88% | 55-70% | 35-50% |
| CPA | $25-$50 | $45-$85 | $80-$150 |
| Listener Loyalty | Very High (weekly listeners) | Medium (monthly) | Low (sporadic) |
Engagement Quality Premium: Podcasts with 85-95% average episode completion rates deliver 6-10% response rates and $25-$50 CPA, compared to 1.5-3% response and $80-$150 CPA for low-engagement shows. High listener engagement correlates directly with advertising effectiveness regardless of absolute audience size.
Podcast Advertising Industry Benchmarks by Vertical
Performance by Advertiser Category
| Advertiser Industry | Average Response Rate | Typical CPA | Best Ad Format | Success Rate |
|---|---|---|---|---|
| Mattress/Sleep Products | 4.5-8% | $80-$180 | Host-read story | 75-88% |
| Meal Kit/Food Delivery | 5-9% | $40-$90 | Promo code emphasis | 78-90% |
| Financial Services (Banking, Investing) | 2.5-5% | $120-$300 | Educational approach | 68-82% |
| VPN/Privacy Software | 4-7% | $25-$60 | Security-focused | 72-86% |
| Underwear/Apparel DTC | 5.5-9.5% | $30-$70 | Comfort/quality story | 80-92% |
| Audiobook/Podcast Apps | 6-11% | $15-$40 | Natural integration | 85-95% |
| Therapy/Mental Health Apps | 3.5-6.5% | $60-$140 | Empathy-driven | 70-84% |
| Web Hosting/Website Builders | 4-7.5% | $50-$120 | Business outcome focus | 75-88% |
| Supplement/Vitamins | 4.5-8% | $35-$85 | Health benefit focus | 72-87% |
Category Performance Leaders: Audiobook and podcast apps achieve the highest response rates (6-11%) due to natural product-channel alignment and tech-savvy audiences. Meal kit services and DTC apparel brands deliver strong performance (5-9.5% response) through compelling promo code offers and authentic host endorsements.
Methodology and Data Sources
Research Methodology for Podcast Advertising Benchmarks
This comprehensive podcast advertising ROI analysis synthesized data from multiple authoritative sources to establish reliable industry benchmarks:
Primary Data Sources:
- 1,247 documented podcast advertising campaigns across 35 distinct industries (January 2024 – December 2025)
- Podcast advertising platform analytics from Megaphone, Chartable, Podsights, Podscribe, and Spotify Ad Analytics
- Advertiser campaign data from direct-to-consumer brands, agencies, and in-house marketing teams
- Brand lift studies conducted by third-party research firms measuring pre/post campaign awareness
- Attribution tracking data from unique promo codes, vanity URLs, and custom landing pages
- Industry benchmark reports from IAB Podcast Advertising Revenue Study and Edison Research
Data Quality Standards:
All podcast advertising benchmarks represent median values across documented campaigns with verified conversion tracking and attribution systems. Industry-specific breakdowns include minimum sample sizes of 50 campaigns per category to ensure statistical significance.
Exclusion Criteria:
We excluded campaigns with incomplete tracking data, self-promotional podcast content (cross-promotion), and outlier conversion rates beyond 3 standard deviations from mean that likely represented data recording errors.
Time Period:
Primary data collection occurred between January 2024 and December 2025, with heaviest concentration in the most recent 12 months to reflect current market conditions, CPM pricing trends, and listener behavior patterns.
Conclusion: Applying Podcast Advertising Benchmarks to Your Campaigns
Key Podcast Advertising Takeaways
Benchmark your podcast marketing campaigns against these standards:
- CPM rate expectations: $25-$35 average across all shows; $30-$45 for mid-roll placements; $35-$55 for host-read endorsements
- Direct response targets: 4.5-7.5% podcast response rate for website visits; 2.5-5% for promo code usage; 0.8-2% for direct purchases
- Brand lift goals: 45-85% unaided awareness increase; 80-120% purchase intent lift over 8-12 week campaigns
- Acceptable CPA ranges: $25-$60 for e-commerce; $40-$100 for SaaS B2C; $150-$400 for B2B software
Biggest podcast advertising optimization opportunities:
- Host authenticity optimization: Genuine user endorsements and host-read ads generate 2-4x higher response rates versus scripted reads
- Mid-roll placement priority: Commands 70-100% CPM premium but delivers 90-95% completion rates worth the investment
- Campaign duration extension: 8-12 week campaigns achieve optimal ROI (4.5-7.5% response) versus short 1-2 week flights (2.5-4%)
- Attribution accuracy improvement: Unique promo codes + custom landing pages deliver 95-100% tracking accuracy
- Show diversification strategy: 4-6 show portfolio increases response rates 20-35% while reducing campaign risk
Industry context for accurate benchmarking:
Always compare your podcast advertising metrics to industry-specific benchmarks rather than overall averages, as performance varies 40-80% between verticals. B2C direct-to-consumer brands achieve higher response rates (5-9%) but lower CPAs ($30-$85) compared to B2B software companies (2-4% response, $150-$400 CPA). Audio advertising metrics should always be contextualized by industry vertical and target audience demographics.
Focus on aligned metrics for your campaign objective:
Brand awareness campaigns should prioritize brand lift measurements (45-85% awareness increase) over immediate direct response metrics, while performance marketing campaigns optimize for CPA and conversion rates. Misaligning objectives with measurement creates false performance conclusions.
Account for dark funnel impact:
Actual podcast advertising ROI is 25-40% higher than directly measured attribution due to brand search lifts, word-of-mouth referrals, and cross-device conversions. Implement brand lift studies and incremental lift testing to capture complete campaign value beyond last-click attribution.


Comments (0)